Business Intelligence
QlikView and Crystal Reports

There is a wealth of information in your company's existing systems (ERP, payroll, etc.). How can you tap into that wealth in order to make use of it? With business intelligence!
Business intelligence (BI) refers to a variety of software applications used to analyze an organization's raw data and present it to help corporate executives, business managers, and other end users make more-informed businessdecisions. VCC offers two different BI reporting tools, which become even MORE powerful in the magical hands of our consultants.
This cutting-edge tool brings a whole new level of analysis, insight, and value to existing data stores with user interfaces that are clean, simple, and straightforward.
Consolidate
QlikView’s patented, in-memory technology rapidly combines data from any source. Plus, drag-and-drop makes integrating data from multiple sources easy.
Search Associatively
QlikView’s associative search provides a familiar search experience to deliver fast business answers. Its intuitive interface highlights important relationships in your data. QlikView extends associative search into every list box across every dashboard, enabling users to search indirectly and quickly find detailed answers to critical questions.
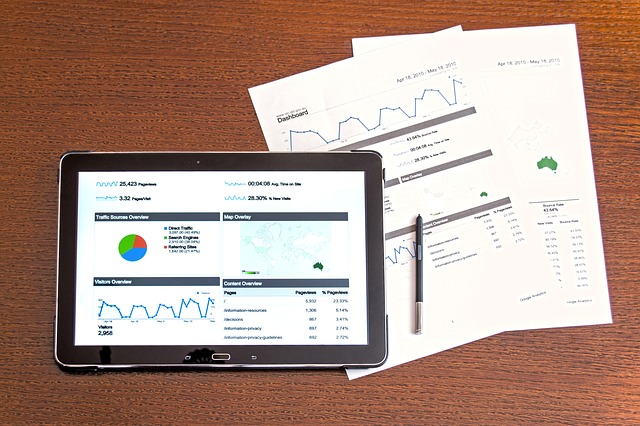
Visualize
Here’s the fun part. In just seconds, see your data any way you want. Put it in charts, tables, graphs—every kind imaginable. Make them 2-D or 3-D. Click anywhere for more detail. Remix and reassemble data in new views and create new visualizations for deeper understanding. With QlikView, you’ll see your data in a whole new light.
KEY FEATURES
For more info please visit:

With Crystal Reports, you can create powerful, richly formatted, dynamic reports from virtually any data source, delivered in dozens of formats, in up to 24 languages. Now that's impressive! Crystal Reports turns data into interactive, actionable information that can be accessed offline or online, from applications, portals, and mobile devices. Crystal Reports allows users to graphically design data connection(s) and report layouts.
With Crystal Reports Visual Advantage, you can gain even more functionality for compelling reports. This bundled product includes Crystal Reports and Xcelsius Engage, giving you the power to create highly formatted reports with what-if scenario models and interactive charts.

KEY FEATURES
For more info please visit:

SPECIALIZATION IN CUSTOMIZATION


